Characterisation and classification of fluorescent dissolved organic matter in water: Current challenges and future directions
by
Khan M.G. Mostofa, Zihuan Fu, M. Mohinuzzaman, Longlong Li, Xinyu Lao, Yijun Liu, and Cong-Qiang Liu
Institute of Surface-Earth System Science, Tianjin University, 92 Weijin Road, Tianjin 300072, China.
Corresponding author: Email address: mostofa@tju.edu.cn
Abstract
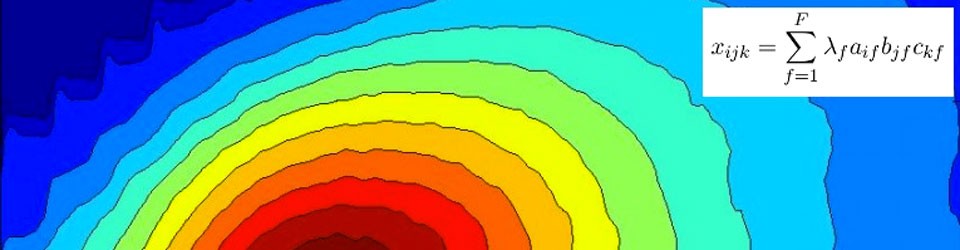
Three-dimensional fluorescence (excitation-emission matrix, EEM) spectroscopy (EEMS) coupled with parallel factor (PARAFAC), EEM-PARAFAC modelling has been extensively applied to identify the sources of fluorescent dissolved organic matter (FDOM) and their biogeochemical processes. But much research did not follow the same method on three key challenges: selective EEM data analysis, calibration of EEM data and classification of fluorescent components, which present challenges to the widespread application of EEM-PARAFAC studies. Based on the evidence, this study suggests that (1) selective EEM data analysis could be performed on each characteristic sample, not all EEM data together, in order to determine the biogeochemical facts and their mechanisms of action on the respective ecosystem; (2) detection of FDOM using EEM-PARAFAC analysis could be performed only on raw EEM data, not on the Raman Unit (RU) calibration data; and (3) classification of fluorescent components could be denoted commonly.
1. Introduction
EEM-PARAFAC modelling has appeared widely since 20031–2 as a precise, fast, powerful and easy tool to identify fluorescent dissolved organic matter (FDOM) in water, soils and atmospheric aerosols. Characteristic observational differences of FDOM, either in their EEM images or in their optical properties (fluorescence peaks and their respective fluorescence intensities), are useful indicators to identify and characterise the sources, and many biogeochemical processes, including seasonal-spatial-temporal-vertical changes in fresh and marine water, photochemical and microbial changes, diurnal variations and so on. Correspondingly, FDOM components are the key fractions of bulk dissolved organic matter, which subsequently play a part in most of all biogeochemical processes in the soil, water and atmospheric environments. However, the application and uses of EEM-PARAFAC analysis on the respective sample EEM spectra still face crucial concerns in three key challenging issues:
2.1 How do selective EEM data analyses perform in distinguishing the biogeochemical facts and their mechanisms? Many researchers currently perform EEM-PARAFAC modelling on different characteristic water samples, e.g., stream, river, polluted river, lakes (surface and deeper water layers) or oceanic samples (coastal site, open ocean, upper and deeper layers) together, to obtain more fluorescent components. This causes several scientific problems: (i) Mixing of fluorescent components occurs at different stages of watercourse; for example, fluorescent components of each stream, river, lake or ocean originate characteristically from these different stages. Mixing of samples results in loss of this information. (ii) Due to mixing of fluorescent components, EEM images are identical for all samples, so do not characterise the real biogeochemical facts and mechanisms for the respective samples; (iii) Due to mixing of fluorescent components between characteristic sampling sites, the fluorescence intensities will exhibit anomalies and so do not correspond to the respective sample. (iv) Image and peak position of the fluorescent components are changed due to mixing of samples, and (v) Any improper Milli-Q deduction from EEM sample data greatly impacts on the fluorescent component image, peak and intensity. Selective EEM data analysis using EEM-PARAFAC analysis of each characteristic sample is vital to identify the specific fluorescent components of each respective sample, which will subsequently provide information on the biogeochemical facts and their mechanisms.
2.2 How do the EEM spectral data calibrate properly without any interference to the original EEM images? Now the question arises about the use of normalisation techniques on the EEM spectra before PARAFAC modelling, to separate and identify individual fluorescent components without any interference to the original EEM images. Many researchers currently apply the Raman Unit (RU) calibration on the EEM spectra before applying PARAFAC modelling1–2. Our results indicate that application of RU calibration to the EEM data is problematic, not only in identifying the authentic fluorescent components, but also by changing their fluorescence properties simultaneously, so they are not consistent with the original EEM spectra. This study evidenced several crucial scientific disadvantages in RU2 calibration: (i) Some fluorescent components, along with fluorescence peak A for humic-like components, and peak TUV for protein-like/other components, appear at shorter excitation wavelengths (<250 nm) which cannot be calibrated and are important in classifying true fluorescent components. (ii) Fluorescence intensities at longer excitation wavelengths are enhanced with respect to the original EEM image along with red-shifting of the respective peak position. (iii) Shapes and images of the fluorescent components differ significantly from the original EEM image. (iv) Artefact components arise in some cases. It is thus suggested to perform PARAFAC analysis on the raw EEM data and then to calibrate the fluorescence intensity of each individual fluorescent component using standard quinine sulphate unit (QSU)2.
2.3 How are FDOM components classified/assigned to generalise the EEM-PARAFAC study? The nomenclature of FDOM components is important to better understand and unify the EEMS study on a common basis worldwide. This study denotes various fluorescent components, identified up to now in soil, water and atmospheric aerosols, by considering the fluorescence spectrum to divide into four spectral regions (C, A, T and TUV). Classification of FDOM could be resolved by two processes: Firstly, parent FDOM and its degraded products could be denoted based on their respective standard or phytoplankton or soil origin. Secondly, unknown FDOM of natural or experimental origin could be defined based on four spectral regions (C: 270–400/360–550 nm, A: 220–275/360–550 nm, T: 250–290/280–360 nm and TUV: 220–250/280–360 nm). For classification, key FDOM components can be defined in soil as soil fulvic acid-C type (Fig. a), soil humic acid (Fig. b), soil fulvic acid-A type (Fig. c), soil fulvic acid-M type (Fig. d), and degraded soil fulvic acid (Fig. e); in waters as allochthonous humic acid (Fig. f: SRHA), allochthonous fulvic acid-C type (Fig. g: SRFA), allochthonous humic/fulvic acid-A type (Fig. h: SRFA), allochthonous fulvic acid-M type (Fig. i: Yellow River),
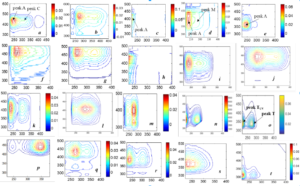
Fig. Fluorescent components identified using EEM-PARAFAC modelling for various samples.
autochthonous fulvic acid-C type (EEM image is similar to soil or allochthonous fulvic acid, Fig. j), autochthonous fulvic acid-M type 1 (peak M has lower intensity than peak A and relatively more stable than M type 2, Fig. k), autochthonous fulvic acid-M type 2 (peak M has higher intensity than peak A, newly produced and rapidly decomposed, Fig. l), extracellular polymeric substances (a combined fluorescence of protein and humic-like components: Fig. m), tryptophan (fluorescence at peak T is lower than in peak TUV-region (ratio = 1:>1.5): Fig. n: standard), free protein-like (fluorescence at peak T is relatively lower, ratio = 1:1.36 for standard protein or equivalent or relatively higher than TUV, Fig. o: standard protein), detergent-like or distyl biphenyl (DSBP)-a component of fluorescent whitening agents (peak C has higher intensity than peak A, Fig. p); in atmospheric aerosols and rainwater as humic-like substances-C type (Fig. q), humic-like substances-M type (Fig. r), degraded humic-like substances-M type (Fig. s); in water, soil and aerosols as tyrosine or phenylalanine (peak T intensity is lower than peak TUV (ratio = 1:>1.5), but varied peak positions Fig. t: standard tyrosine).
3. Conclusion
EEM researchers need to follow the same technique for selective EEM data analysis, normalisation and classification of fluorescent components in order to generalise EEM-PARAFAC studies worldwide.
Reference
(1) Stedmon CA et al. (2003) Mar Chem 82:239-254
(2) Mostofa KMG et al. (2013) Photobiogeochemistry of Organic Matter: Principles and Practices in Water Environments. Springer, Berlin Heidelberg
Acknowledgements: Université de Toulon, NSFC, National R & D Program, Prof. Liu CQ and MS+PhD students.